The Growth Engine
How Cabarrus County became one of the fastest-growing places in North Carolina
North Carolina has 100 counties. Most of them, scattered across the coastal plain and the mountain hollows, have spent the past two decades watching younger residents leave for opportunity elsewhere. Their downtowns thinned out. Their school enrollments declined. Their tax bases strained.
And then there is Cabarrus County.
Between 2000 and 2023, Cabarrus grew by 83%, adding more than 109,000 new residents to a county that began the century with just 131,063 people. That ranks it 5th in the state for percentage growth. It is not a statistical artifact or a one-time boom. It is a sustained, structural shift driven by forces that show no sign of reversing.
Scroll through the story below to see how Cabarrus’s growth compares to the rest of North Carolina, why it is part of a larger regional cluster, and what the numbers reveal about the county’s trajectory.
Key Findings
- Cabarrus County grew by 83% between 2000 and 2023, adding more than 109,000 residents. That ranks it 5th out of 100 North Carolina counties for percentage growth over that period.
- The growth is not a local accident. A hot spot analysis places Cabarrus in the Hot Spot (99%) category, meaning the surrounding region grew fast as well. Cabarrus is the statistical core of the most concentrated growth cluster in the state.
- Population has increased every year on record. Growth accelerated after the 2010s and reached its highest annual rates in the post-pandemic period, as remote work expanded the effective commute radius of the Charlotte metro.
- Within the county, growth is uneven. The median census tract grew 14% between 2010 and 2020, but individual tracts range from -4.8% to 188.4%, reflecting where developable land and highway access overlap.
How Fast, and Where It Stands
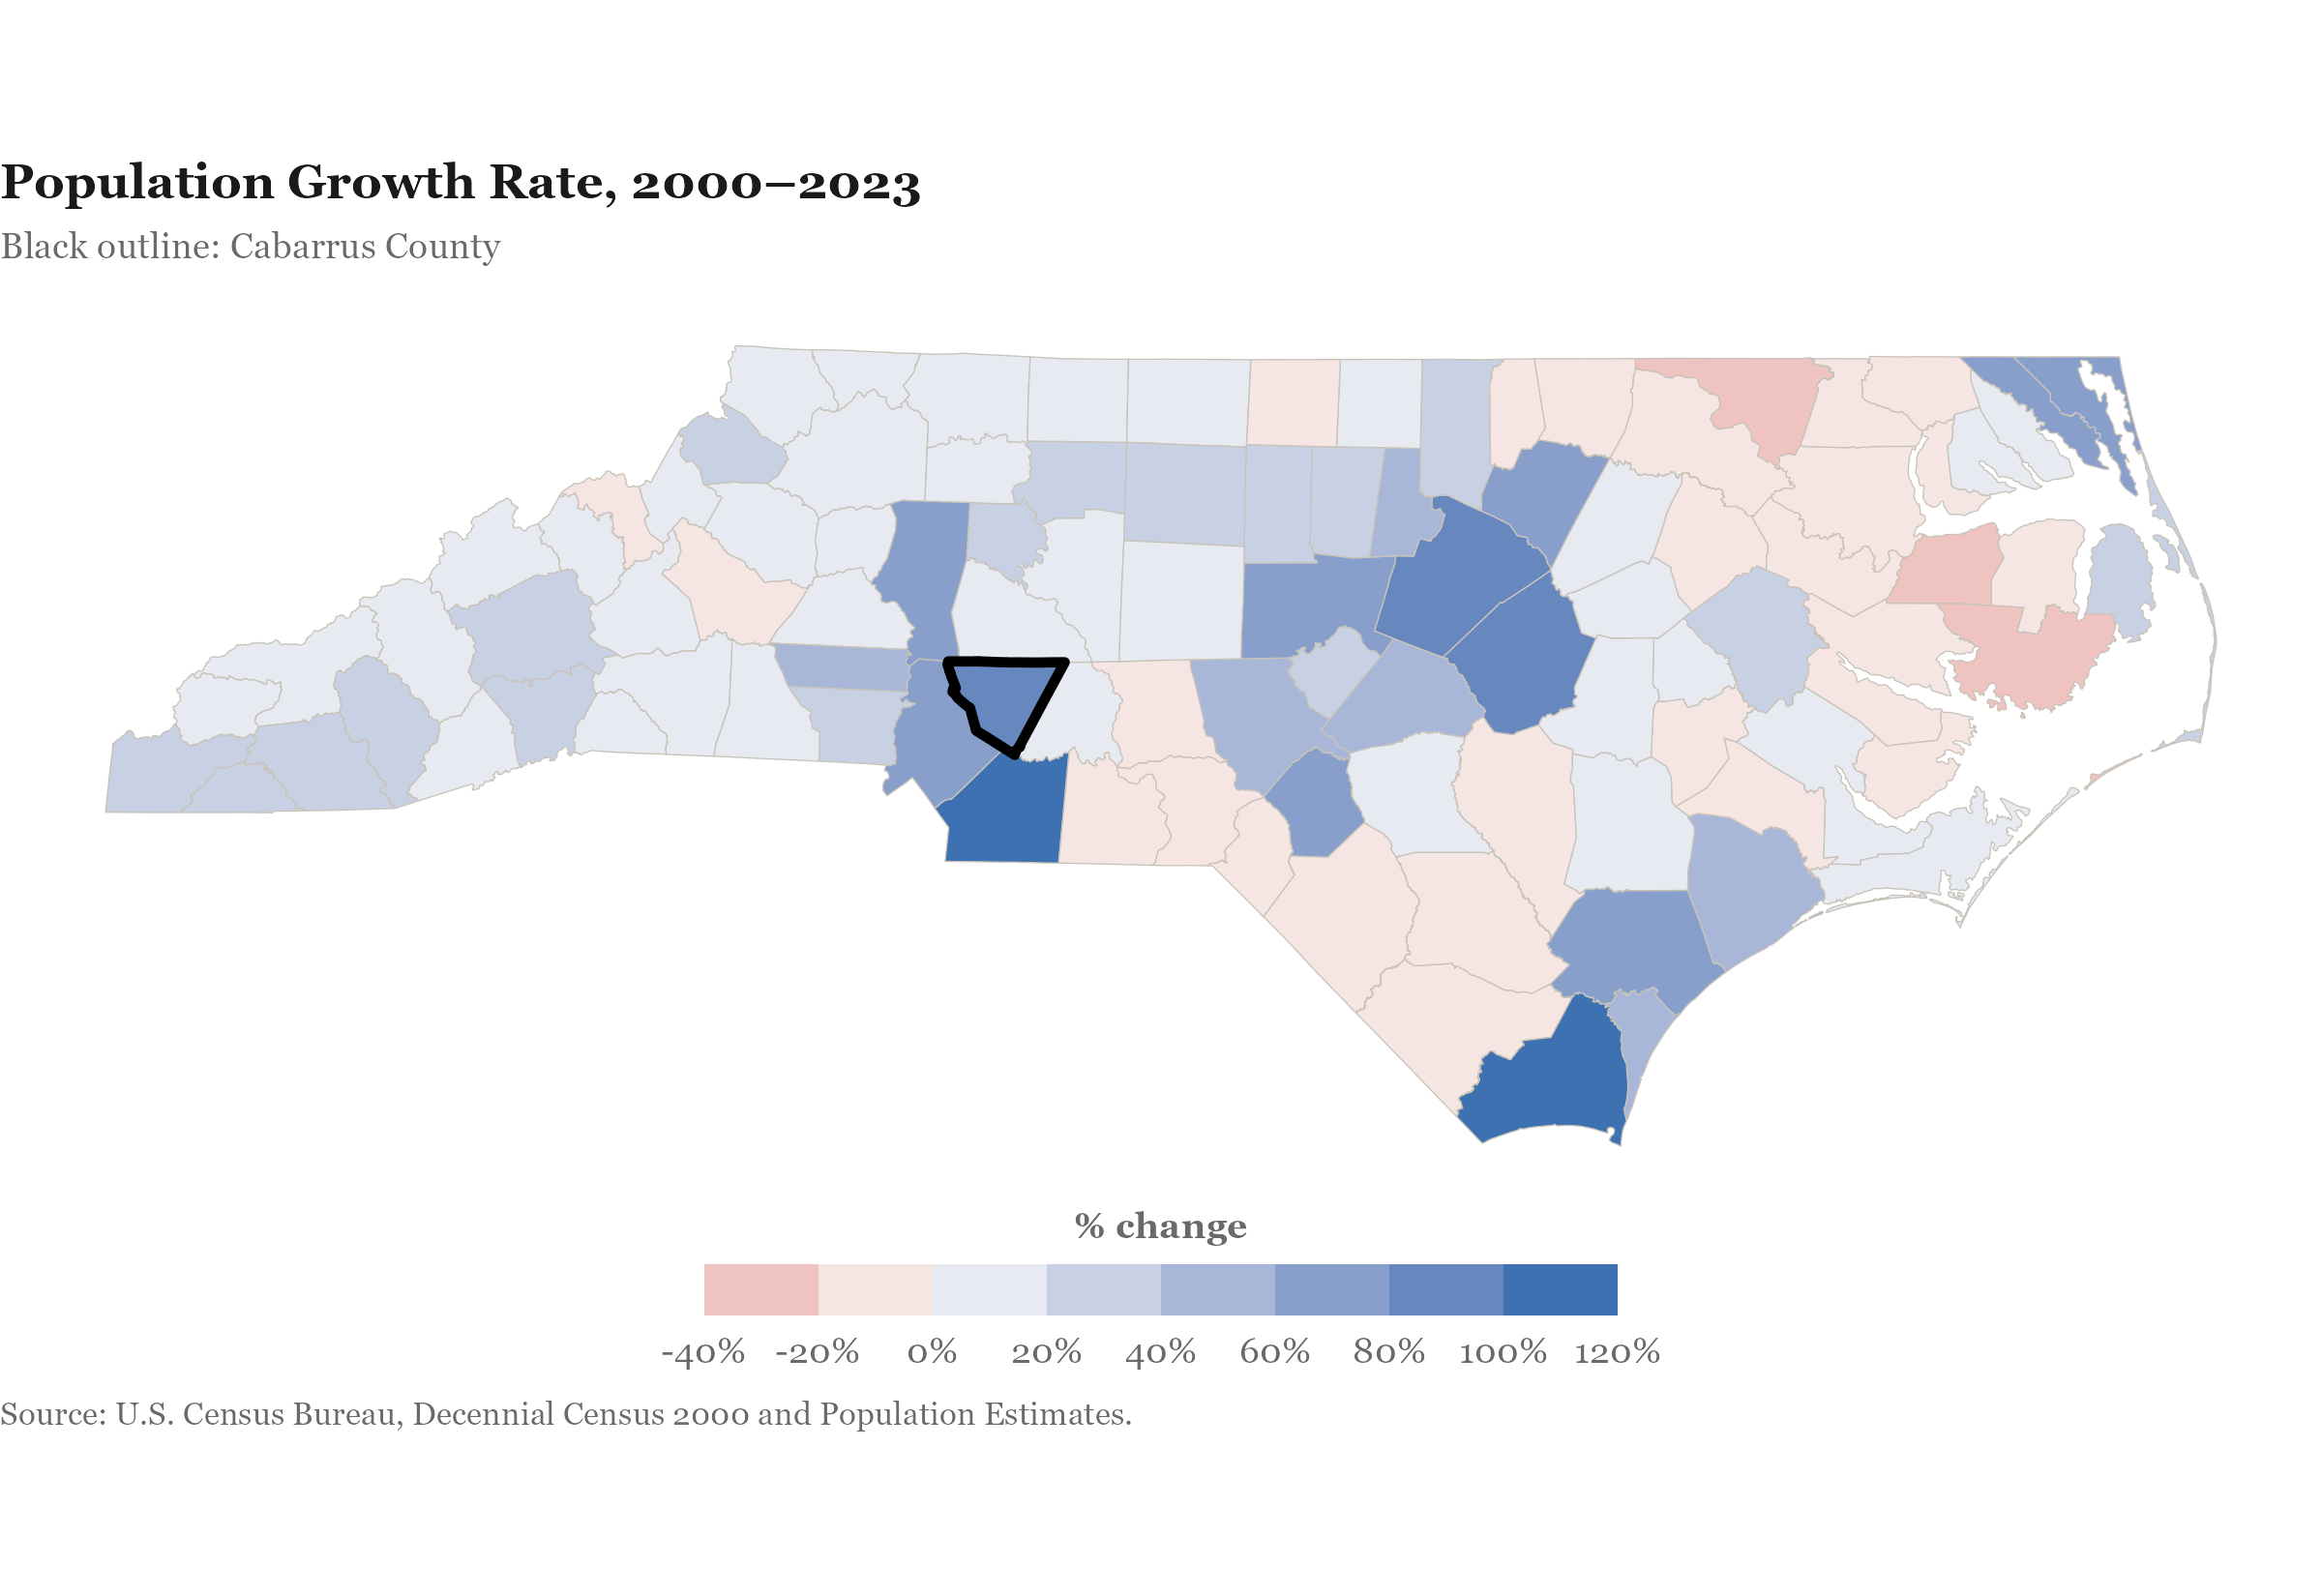
North Carolina’s growth story is sharply uneven. The map to the right shows every county colored by its percentage population change since 2000. Blue counties grew. Red counties shrank. The pale band in the middle barely moved.
Growth is not random. It concentrates in two corridors: the Research Triangle around Raleigh-Durham in the center-east, and the Piedmont Crescent sweeping up from Charlotte through Cabarrus and into Forsyth County. Western mountain counties and the eastern coastal plain tell a very different story. The amber outline on the map marks Cabarrus County.
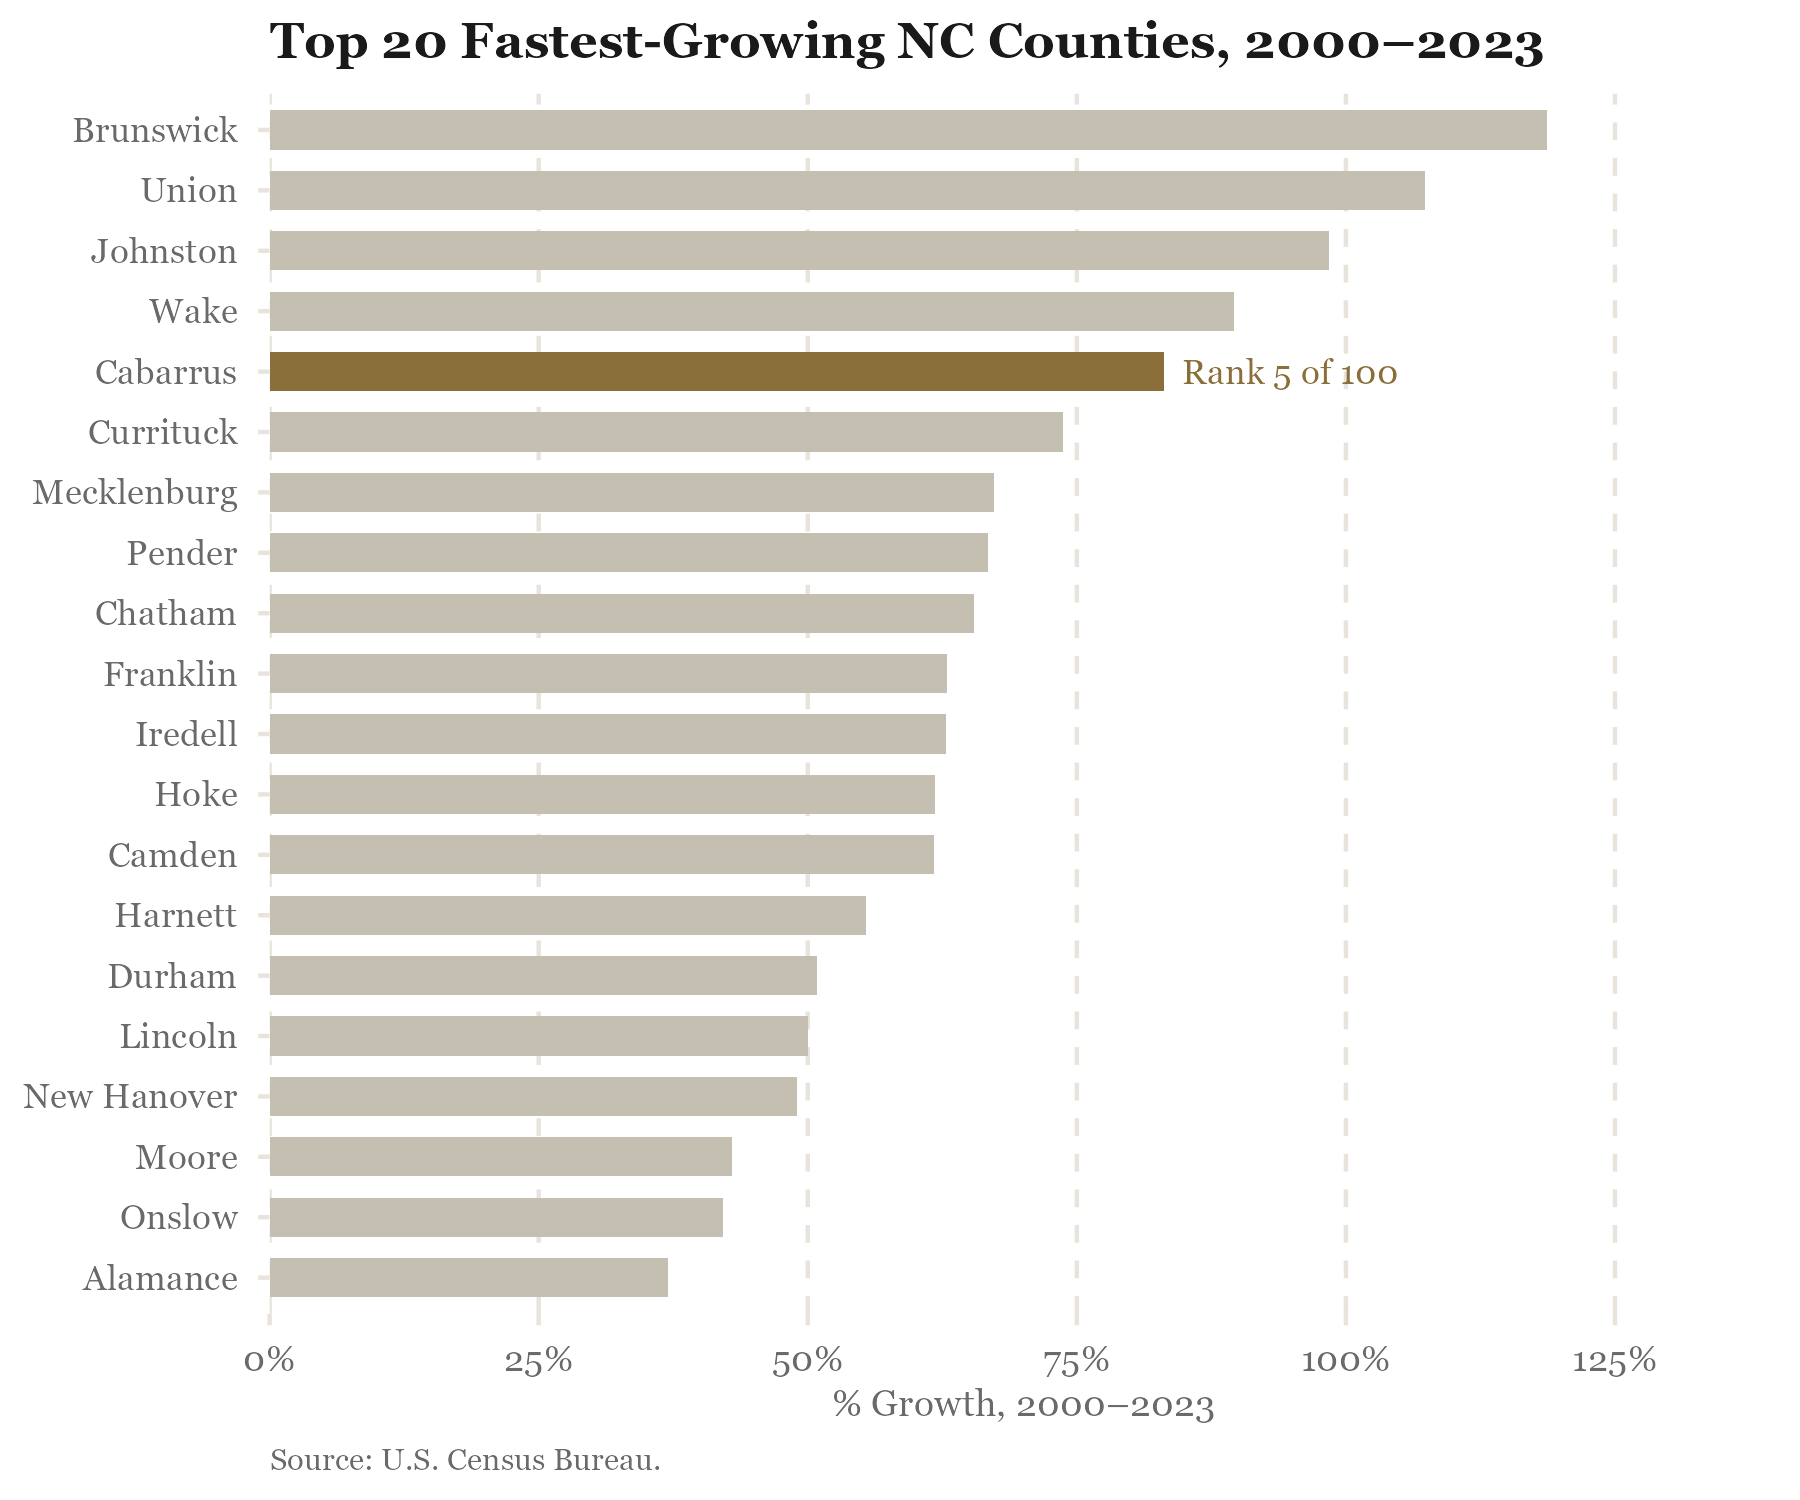
This bar chart narrows the lens to the 20 fastest-growing counties in the state. This is the company Cabarrus keeps: suburban and exurban counties orbiting the state’s major metros, all of them benefiting from the same out-migration forces that pushed households away from expensive city cores. Cabarrus sits near the top, highlighted in amber.
The NC county median growth rate over this period was 11.3%. Cabarrus grew at 7.4 times that pace.
A Cluster, Not a Spike
A county that jumps the growth rankings could be a local accident: a single large employer arrives, a reservoir community draws retirees, and an otherwise ordinary county spends a decade at the top of the list before settling back. That is not what is happening in Cabarrus.
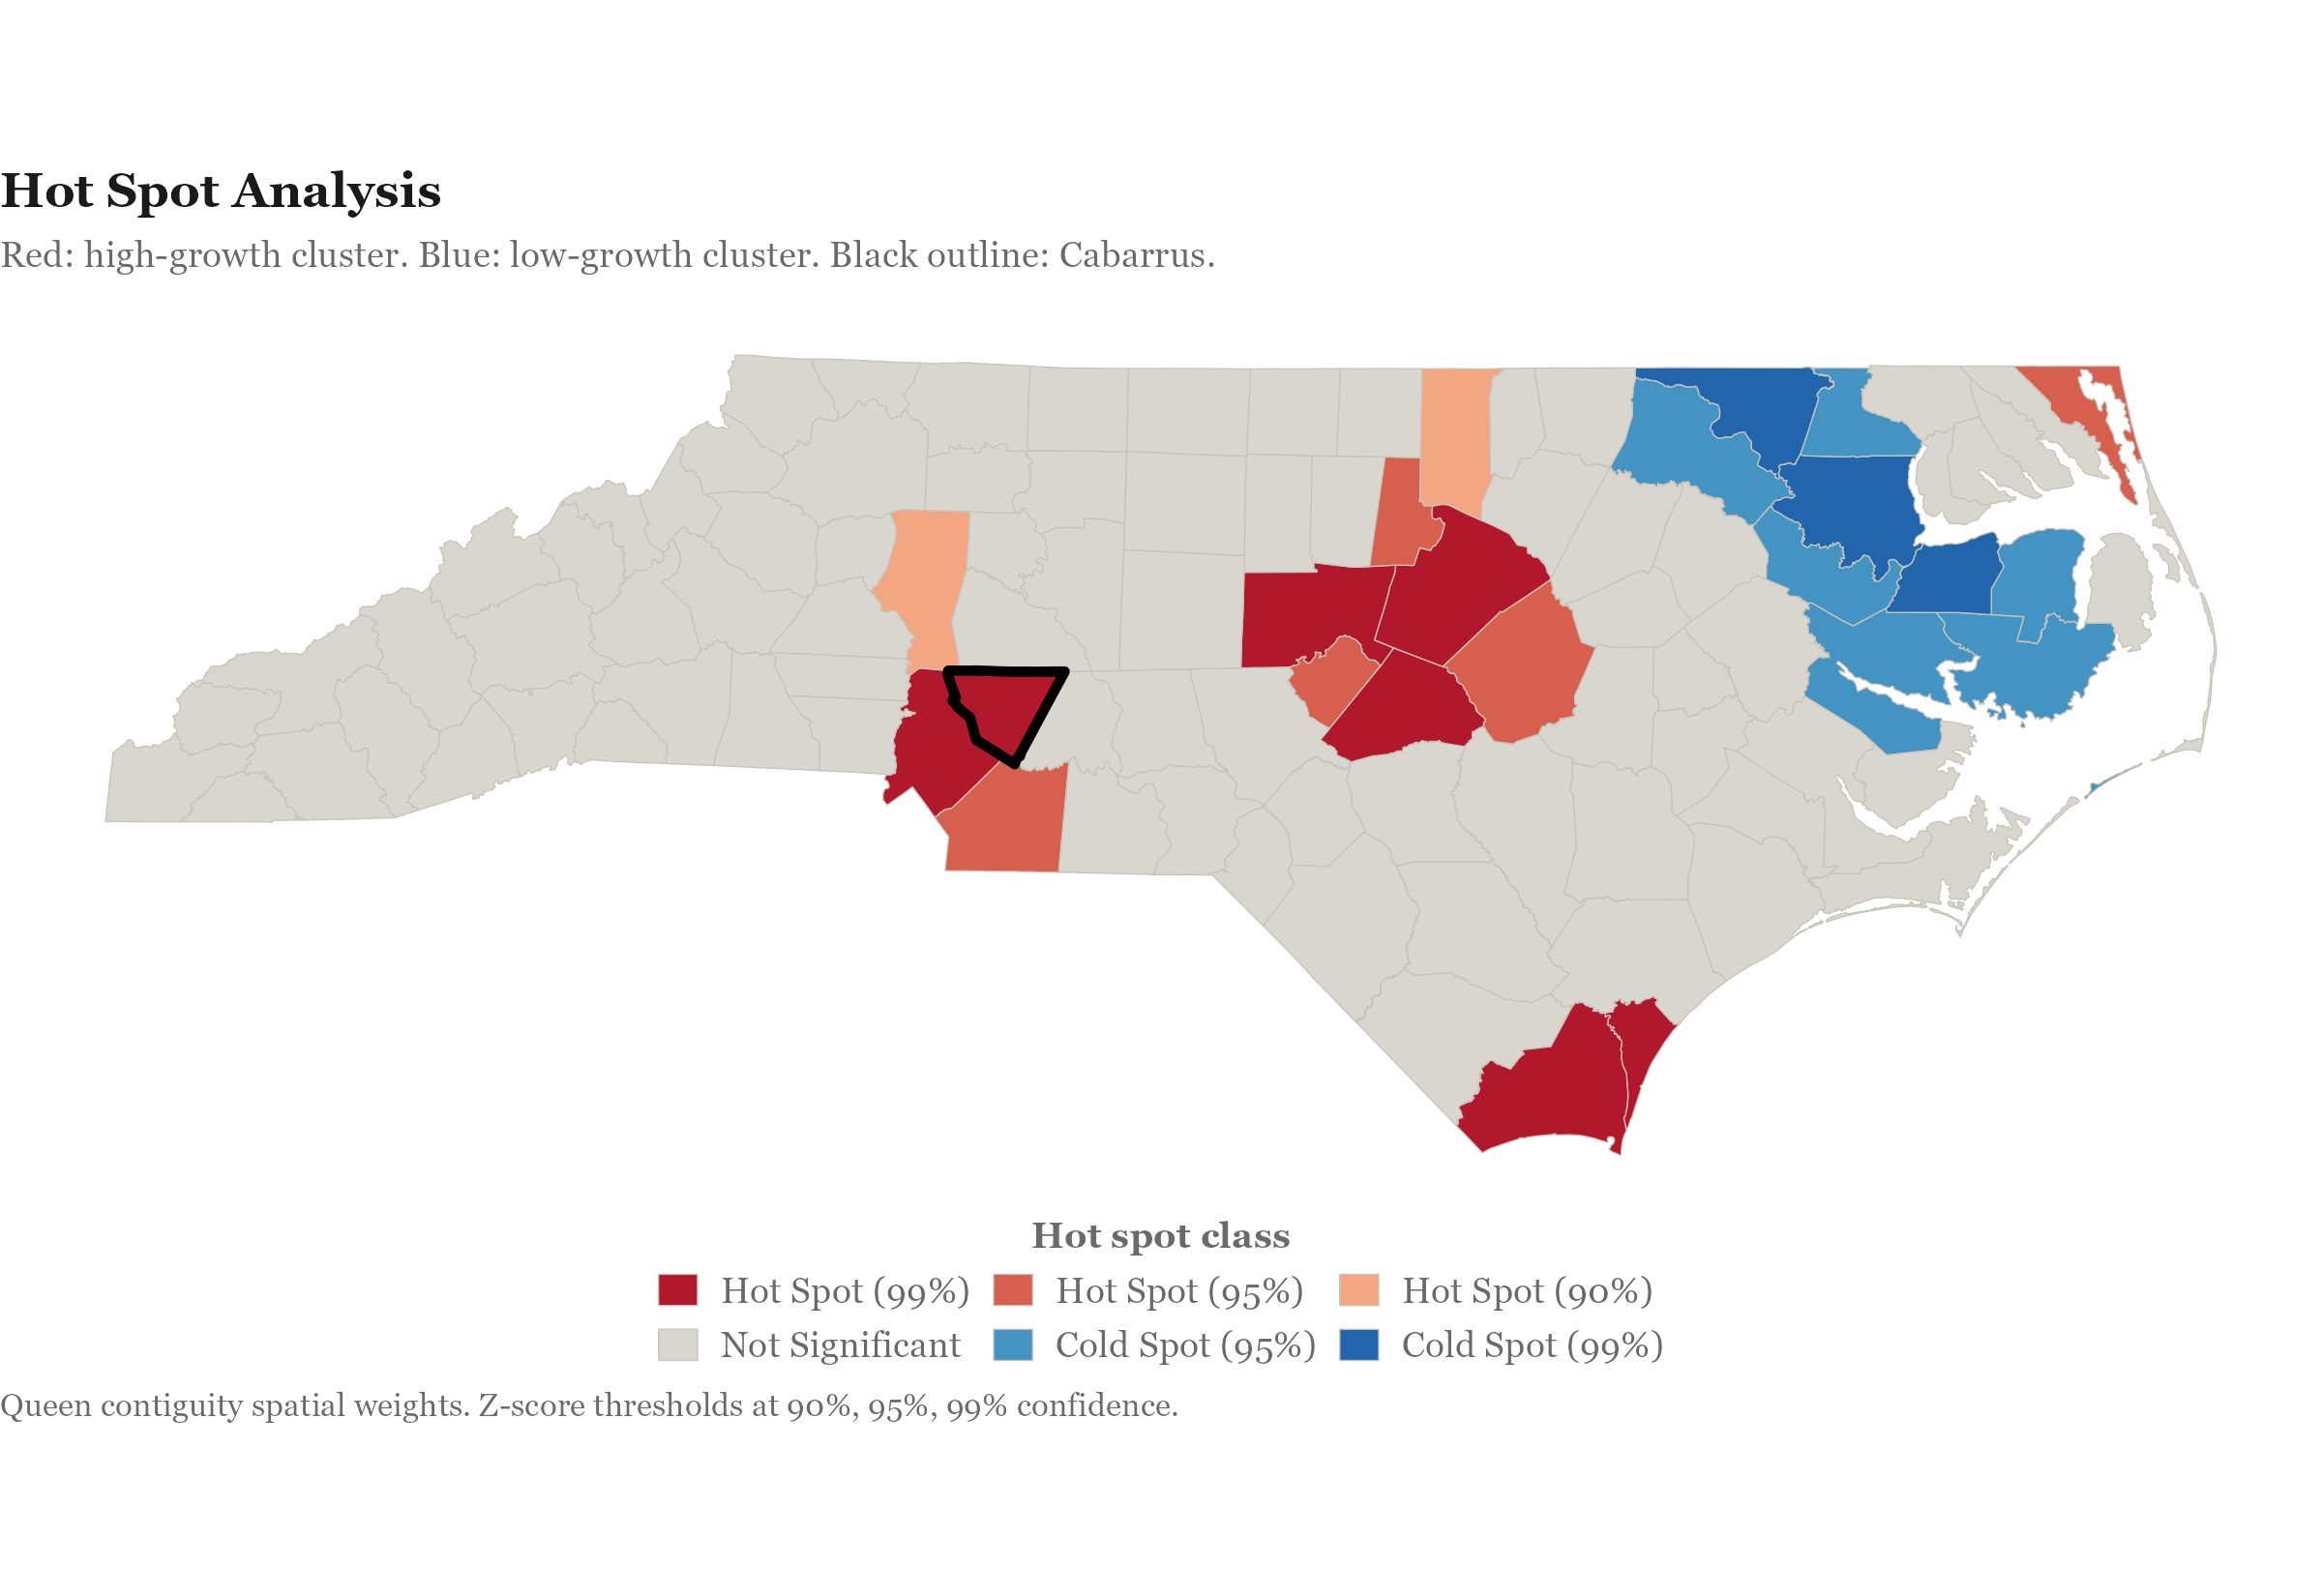
The map shows the result of a hot spot analysis, a spatial statistics method that tests whether a county’s growth rate is part of a genuinely clustered regional pattern or merely a local spike. Counties in red grew fast; critically, so did their neighbors. Counties in blue contracted alongside their neighbors. Gray counties showed no meaningful spatial pattern.
The analysis places Cabarrus in the Hot Spot (99%) category. There is less than a 1% probability that this level of clustered high growth occurs by chance. Cabarrus is not an outlier. It is the core of the most concentrated growth cluster in North Carolina.
The cluster encompasses Mecklenburg (Charlotte proper), Union County to the south, and Iredell County to the north. The pattern traces a regional dynamic: as Charlotte’s core grew expensive and congested, households fanned outward. Cabarrus, with direct I-85 access, lower land costs, and strong public schools, absorbed a large share of that overflow, and then attracted additional employers who followed the workforce.
Year by Year
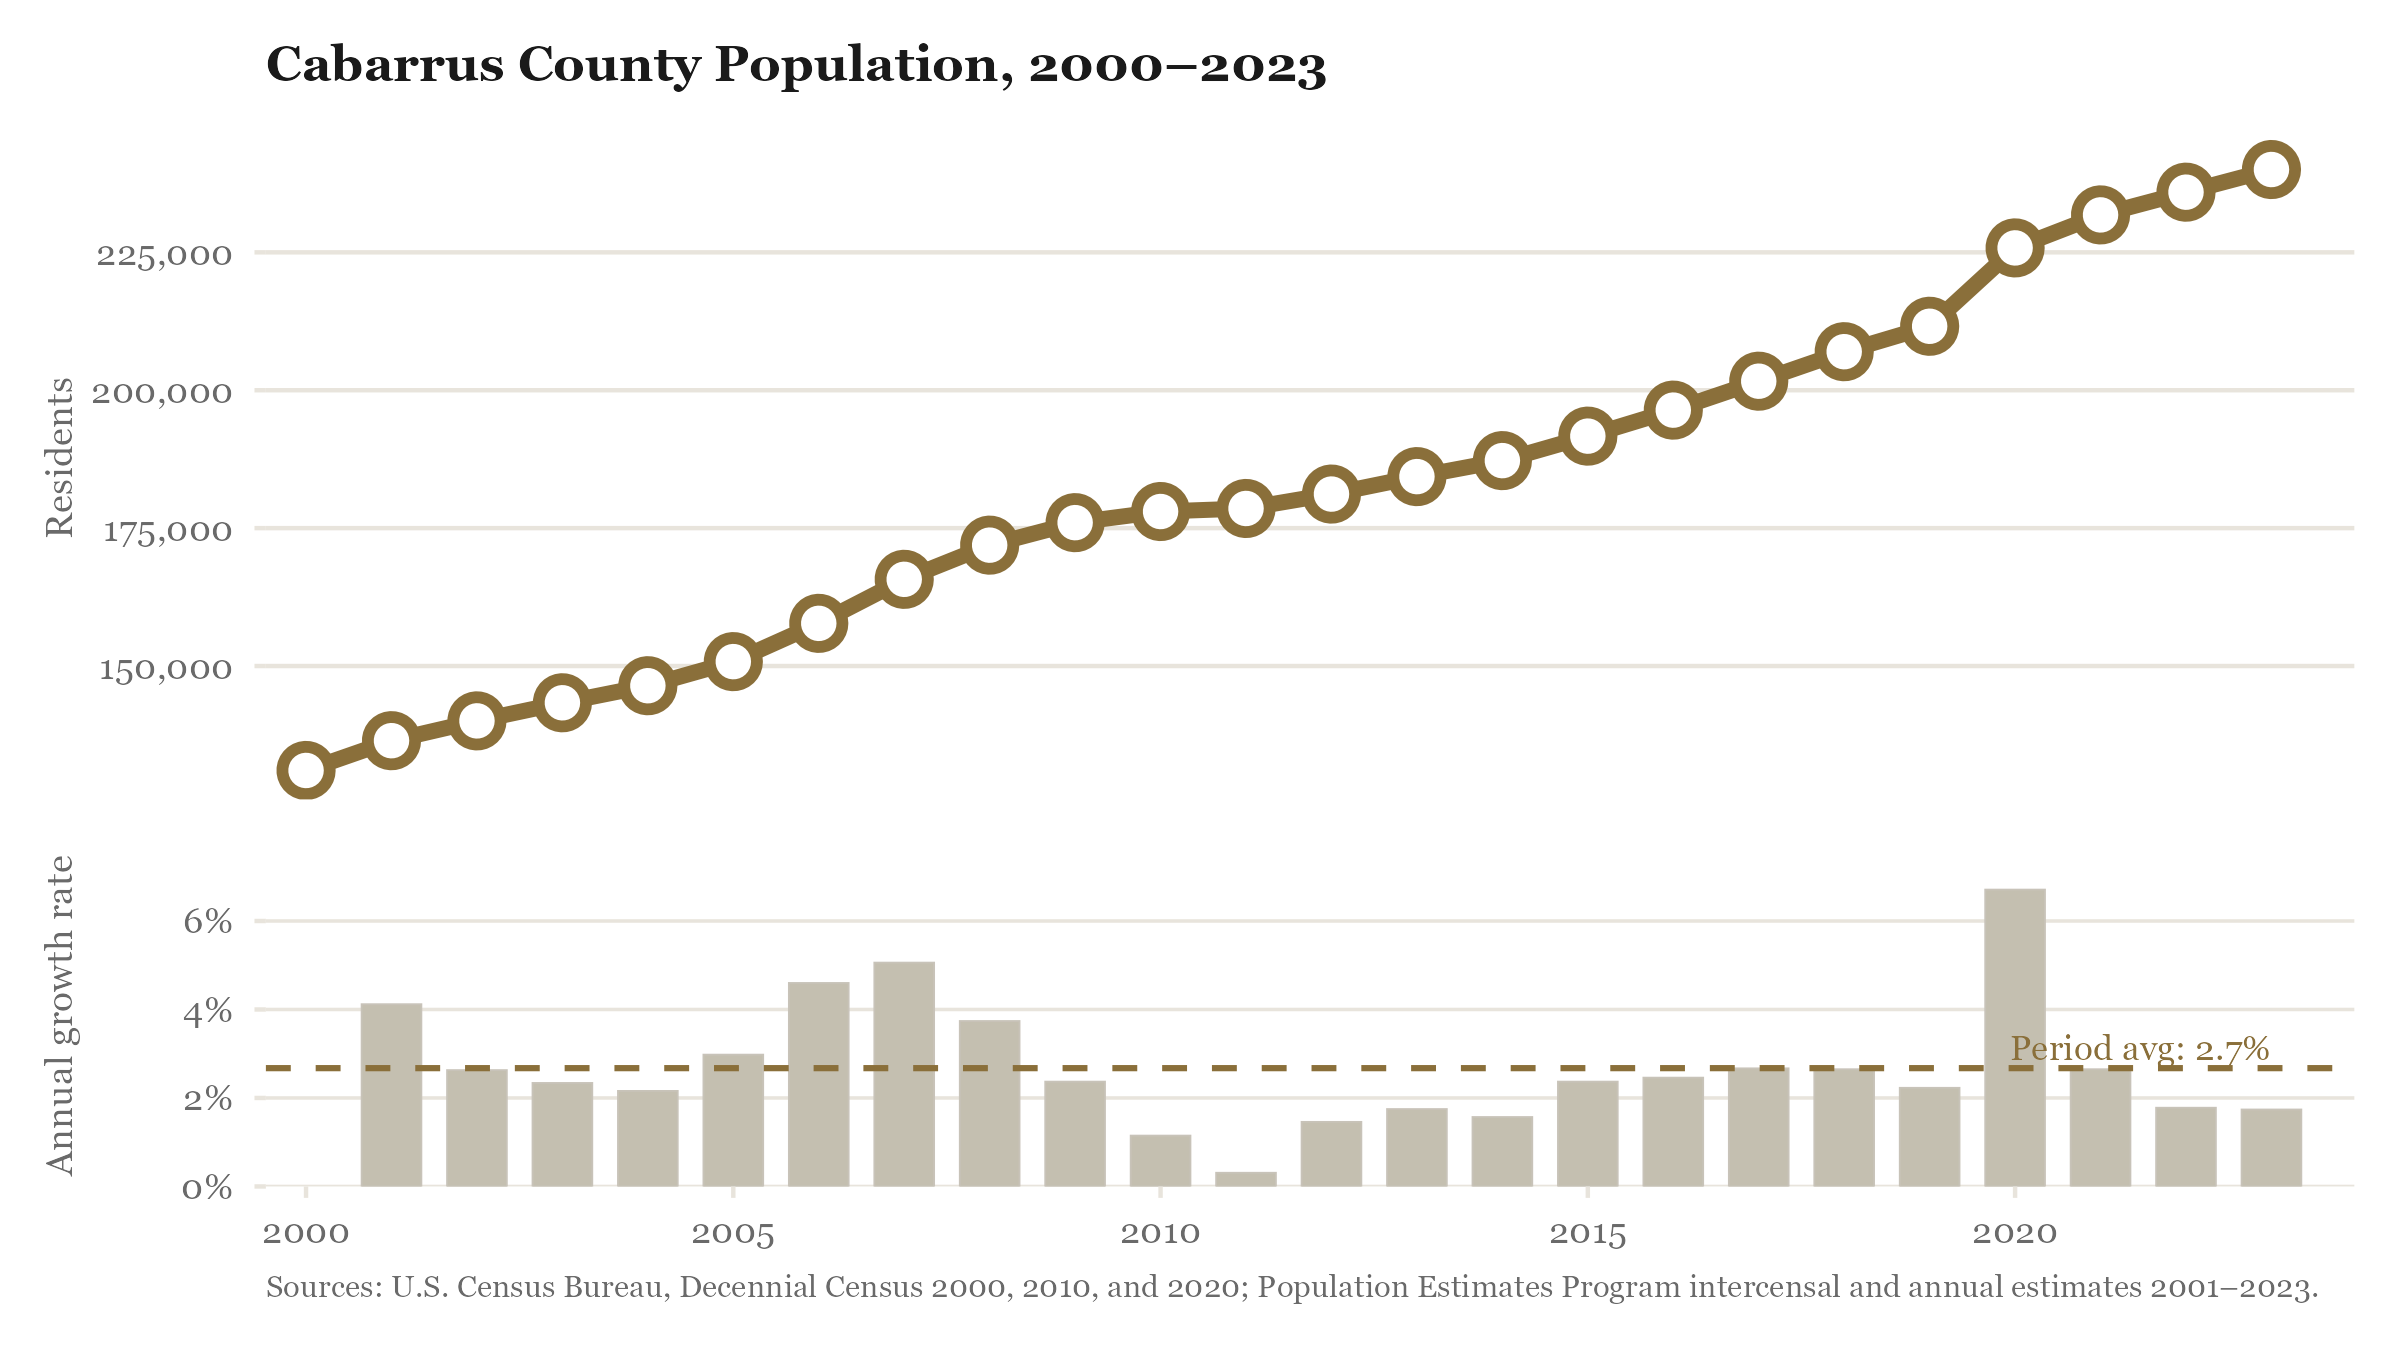
Raw growth percentages show how far a county has traveled between two Census snapshots. They do not reveal whether that journey was steady or turbulent, accelerating or slowing. The chart to the right shows Cabarrus County’s population for every year on record.
The 2000s brought consistent growth: new subdivisions spreading across former farmland, families arriving from Charlotte and from out of state. The 2007-2009 recession briefly slowed homebuilding, visible as a slight flattening of the curve. But the slowdown was modest compared to what many housing-dependent counties experienced.
The 2010s produced acceleration. As Charlotte’s economy recovered and expanded, the outer ring of suburbs resumed their build-out. Cabarrus added residents faster each year than the year before. Then the post-pandemic period arrived with some of the sharpest annual gains on record: remote work freed households from proximity to the city center, and Cabarrus was exactly the kind of place (larger homes, lower prices, good infrastructure) that benefited most.
Each bar in the lower panel records a single year’s growth rate: how fast the county added residents relative to the year before. The dashed line marks the period average of 2.7% annual growth across the full record. Most years cluster near that baseline, reflecting steady, structurally driven growth. Two departures stand out. A trough around 2010 captures the Great Recession’s effect: homebuilding stalled, in-migration slowed, and Cabarrus decelerated, though it never posted an outright decline. The surge beginning in 2019 and intensifying through 2021 reflects the pandemic-era reshuffling of residential geography; remote work freed households from proximity to the city center, and Cabarrus absorbed a disproportionate share of the outflow from higher-cost metros. The consistency between those departures matters as much as the departures themselves: this is a county that grows in good years and merely slows in difficult ones.
Where Growth Has Concentrated
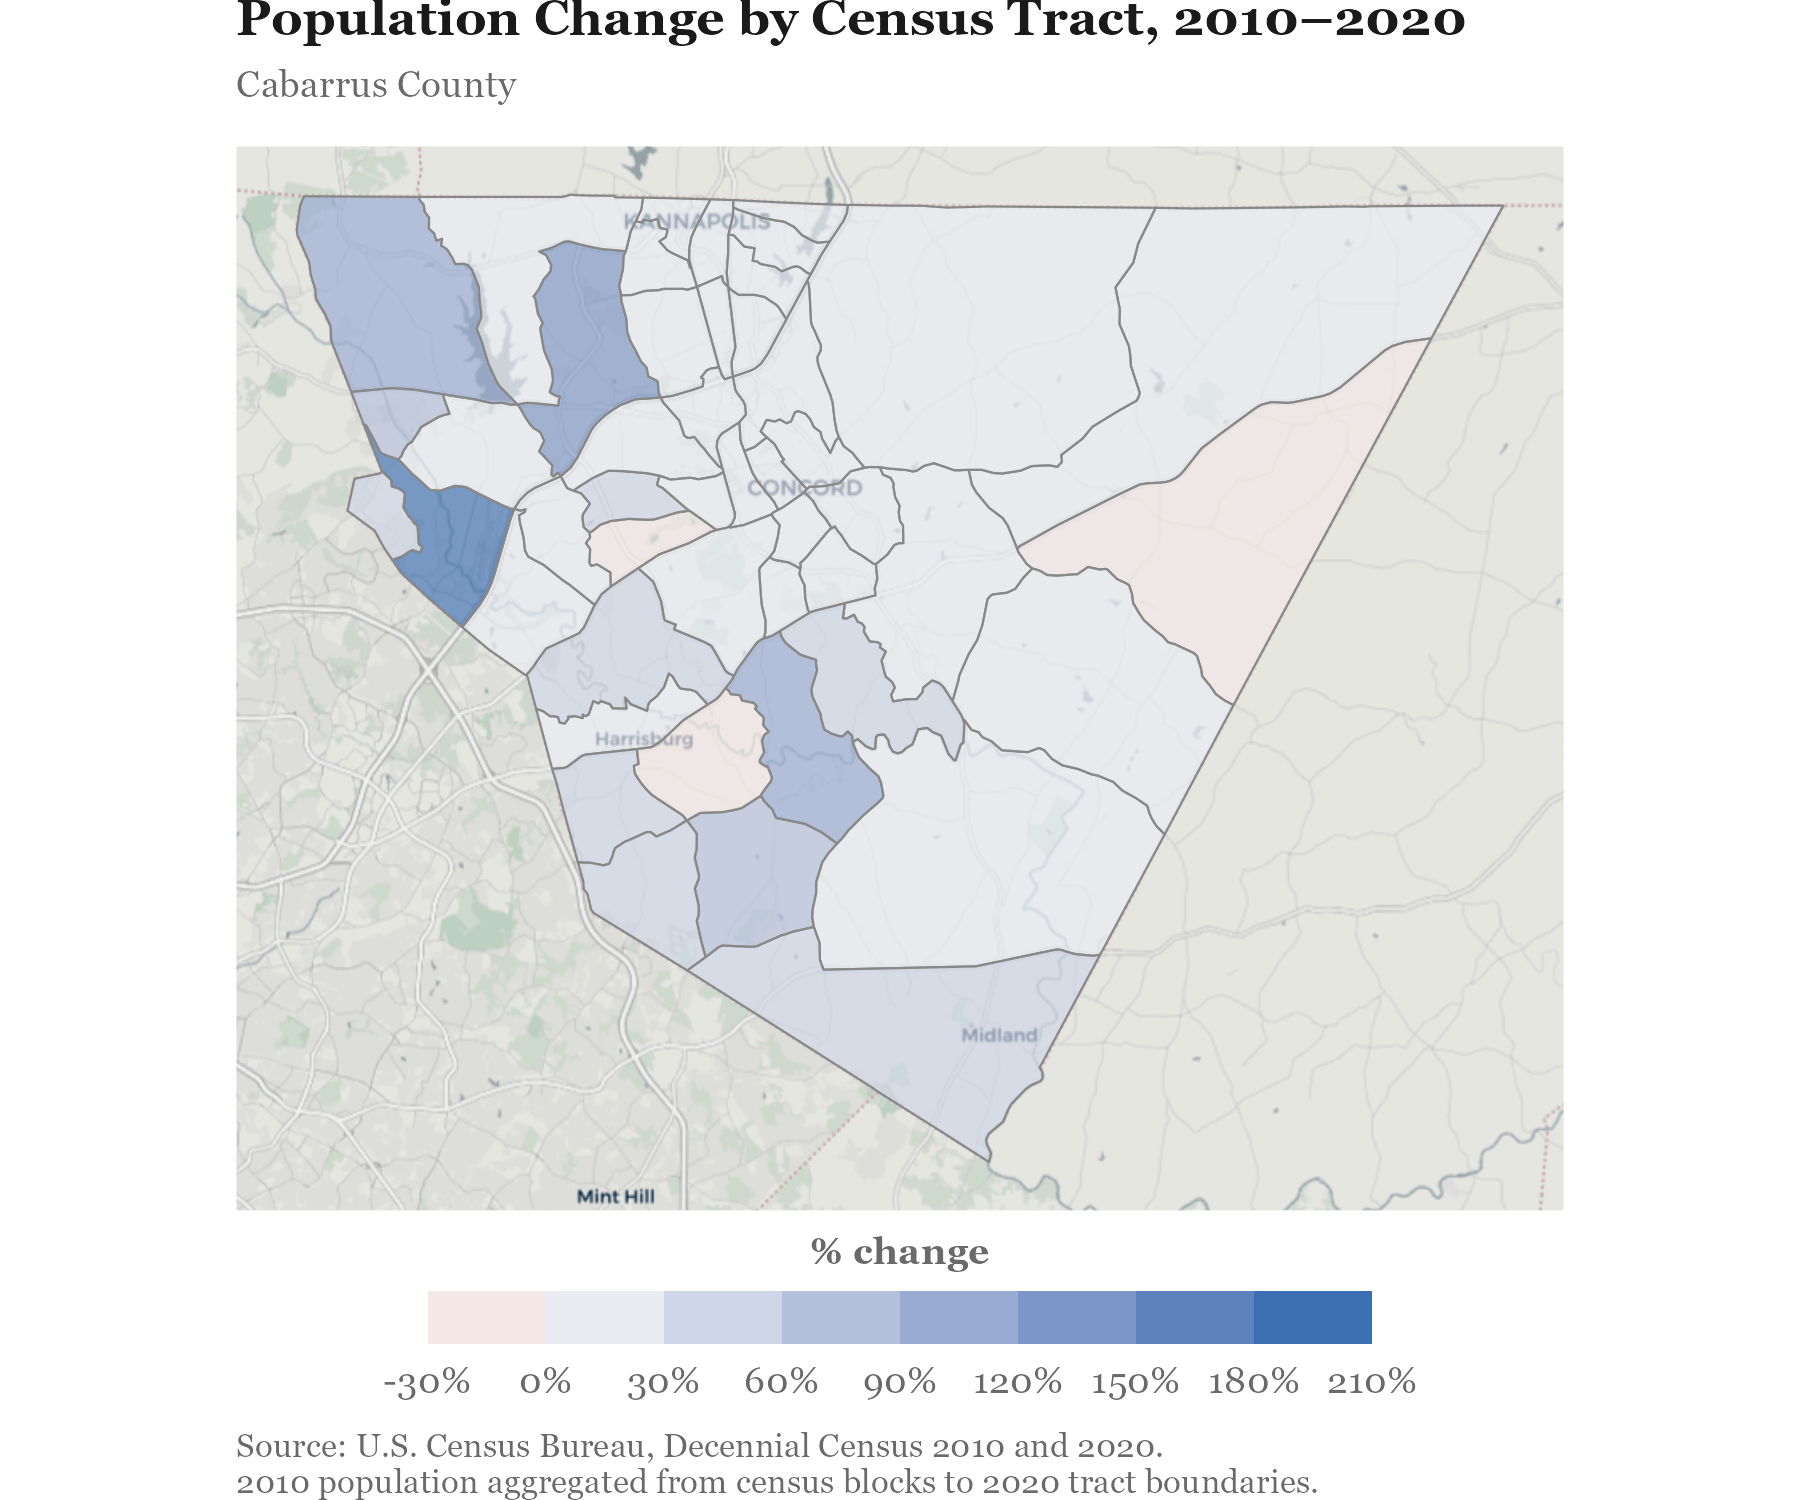
The county-level numbers describe how fast Cabarrus has grown. They do not say where within the county that growth has landed. The 47 census tracts that tile Cabarrus County tell a more granular story: the growth that registers as a single headline figure is, on the ground, a patchwork of fast-expanding areas and quieter corners.
Across all tracts, the median population change between 2010 and 2020 was 14%. The fastest-growing tract added residents at a rate of 188.4%, while -4.8% marks the slowest end of the range. That spread, wide enough to encompass both robust suburban build-out and near-stagnant corners of the county, is what aggregate growth figures obscure.
The spatial pattern encodes the underlying logic of suburban expansion: growth concentrates where developable land meets highway access and new infrastructure. The quieter tracts tend to be either long-established neighborhoods near the county seat where most lots are already built out, or rural areas at the county’s edges where the suburban wave has not yet arrived.
Explore the Data
The static maps above capture the overall pattern. The interactive versions below let you click into individual counties for exact figures.
Growth Rate by County (click any county for details)
Hot Spot Classification (click for details)
Population Change by Census Tract, 2010–2020 (click for details)
What It Means
The 23-year arc of growth documented here has created Cabarrus County’s most urgent planning challenges. Infrastructure designed for 131,000 residents now serves nearly 240,000. Road networks, school capacity, water and sewer systems, and emergency services all reflect population figures that no longer exist.
More growth is coming. The forces driving in-migration (Charlotte’s economic expansion, Cabarrus’s relative affordability, highway access) have not reversed. The questions facing county planners are not whether to accommodate growth, but how: where to direct it, what to preserve in the process, and how to ensure the infrastructure keeps pace.
Those questions touch land use, housing affordability, and the conversion of farmland and natural areas: the subjects of the next stories in this series.